
Introduction
The categorization of emerging economies significantly affects international business strategies. This article analyzes 47 emerging and frontier economies from 2009 to 2021, introducing the REE (Redefine, Embed, Elevate) Framework. This approach integrates the UNCTAD’s Productive Capacities Index (PCI) with the KOF Globalization Index (Dreher, 2006) for multidimensional market understanding.
The analysis showed that traditional classifications are often oversimplified, affecting businesses, policymakers, and communities. Metrics such as GDP and broad regional groupings fail to capture the specific realities of these markets. We can better understand an economy’s development and potential by integrating productive capacities and globalization indices.
These insights impact practitioners in refining market entry strategies, policymakers in designing effective economic policies, and IB scholars in rethinking emerging market dynamics.
Understanding Emerging Economies
The classification of emerging economies (EEs) has evolved significantly since Antoine van Agtmael coined the term in 1981 (Sidaway & Pryket, 2000). However, no standardized list of countries universally agreed upon as EEs exists (Grosse & Meyer, 2019; Hoskisson, Eden, Lau, & Wright, 2000; Hoskisson, Wright, Filatotchev, & Peng, 2013; Luo, 2002). The current classifications are summarized in Table 1, showing the criteria and limitations.
Given the diverse development paths of EEs, this study proposed an alternative classification method. By integrating the Productive Capacities Index (PCI) with the KOF Globalization Index, evolution was examined through a more refined measurement. The PCI incorporates eight dimensions: human capital, natural capital, energy, information and communication technology (ICT), structural change, transport, institutions, and the private sector (UNCTAD, 2023).
Globalization is a critical external factor that influences the development of emerging economies (Dreher, 2006; Gygli, Haelg, Potrafke, & Sturm, 2019). The KOF Globalization Index quantifies its impact by capturing economic integration, social connectivity, and political cooperation.
Emerging and Frontier Economies Classification
This study classifies 47 Emerging and Frontier Economies (EMFEs) from 2009 to 2021 to account for variations in global recessions (Kose & Ohnsorge, 2020). The selection was based on IMF, MSCI, and S&P classifications (see Table 2).
The classification process incorporates nine key indicators that provide a comprehensive picture of each economy’s development status and trajectory: the KOF Globalization Index (measuring economic integration, social connections, and political engagement), and eight PCI pillars (structural change, energy access and affordability, human capital development, institutional quality, natural capital management, ICT infrastructure, transportation networks, and private sector development). These indicators capture both the internal development capacities and the external integration levels of emerging economies.
To identify meaningful patterns, all measured variables were standardized and applied Dynamic Time Warping (DTW) clustering was applied. This method identifies similarities in development trajectories over the entire 2009-2021 period, regardless of starting points or absolute values. This time-series clustering approach addresses the complexities highlighted by recent critiques of oversimplified EM classifications (Cavusgil, 2021; Hoskisson, Wright, Filatotchev, & Peng, 2013; Nielsen et al., 2018).
Unveiling Hidden Patterns: Classification Results
Countries in the same group exhibit similar patterns of change in their economic indicators over time. Table 3 shows the structure of each group, with the values representing standardized coefficients, indicating how each cluster’s trajectory compares with the average pattern across all countries.
Steady Risers – Cluster 0
This cluster includes Bangladesh, Bulgaria, China, Colombia, Croatia, Czech Republic, Estonia, India, Jamaica, Kazakhstan, Kenya, Latvia, Lithuania, Morocco, Nigeria, Pakistan, Romania, Russia, Serbia, and the UAE. These countries are slightly below the average for most indicators and have economies with gradual and steady growth. They showed balanced incremental improvement across multiple developmental dimensions without dramatic spikes in any area.
Robust Accelerators – Cluster 1
This cluster includes Chile, Hungary, Indonesia, Kuwait, Malaysia, Mexico, Peru, the Philippines, Poland, Qatar, Sri Lanka, Thailand, and Türkiye. Countries in this group performed above average in most indicators, particularly in energy, transport, and private sector development. They represent economies with strong growth across multiple sectors, having built dynamic business environments, and robust infrastructure systems..
Talent-Rich Challengers – Cluster 2
This cluster included Argentina, Egypt, Greece, Jordan, Slovenia, Tunisia, and Ukraine. The distinguishing characteristic is the above-average performance in human capital and globalization metrics, despite challenges in other areas. These economies have developed educational systems and workforce capabilities, creating substantial human capital advantages while facing economic headwinds in structural change and private sector development, which may limit their ability to fully capitalize on this talent pool.
Resource Rollercoasters – Cluster 3
This cluster encompasses Brazil, Namibia, Slovakia, South Africa and Zambia. Countries in this group show below-average scores for most indicators but demonstrate above-average performance in institutions and natural capital management. This pattern may represent economies experiencing volatile trajectories due to resource dependence while maintaining strong institutional frameworks despite economic challenges. Their development patterns reflect the complexities of navigating resource-driven cycles while building a stable governance system.
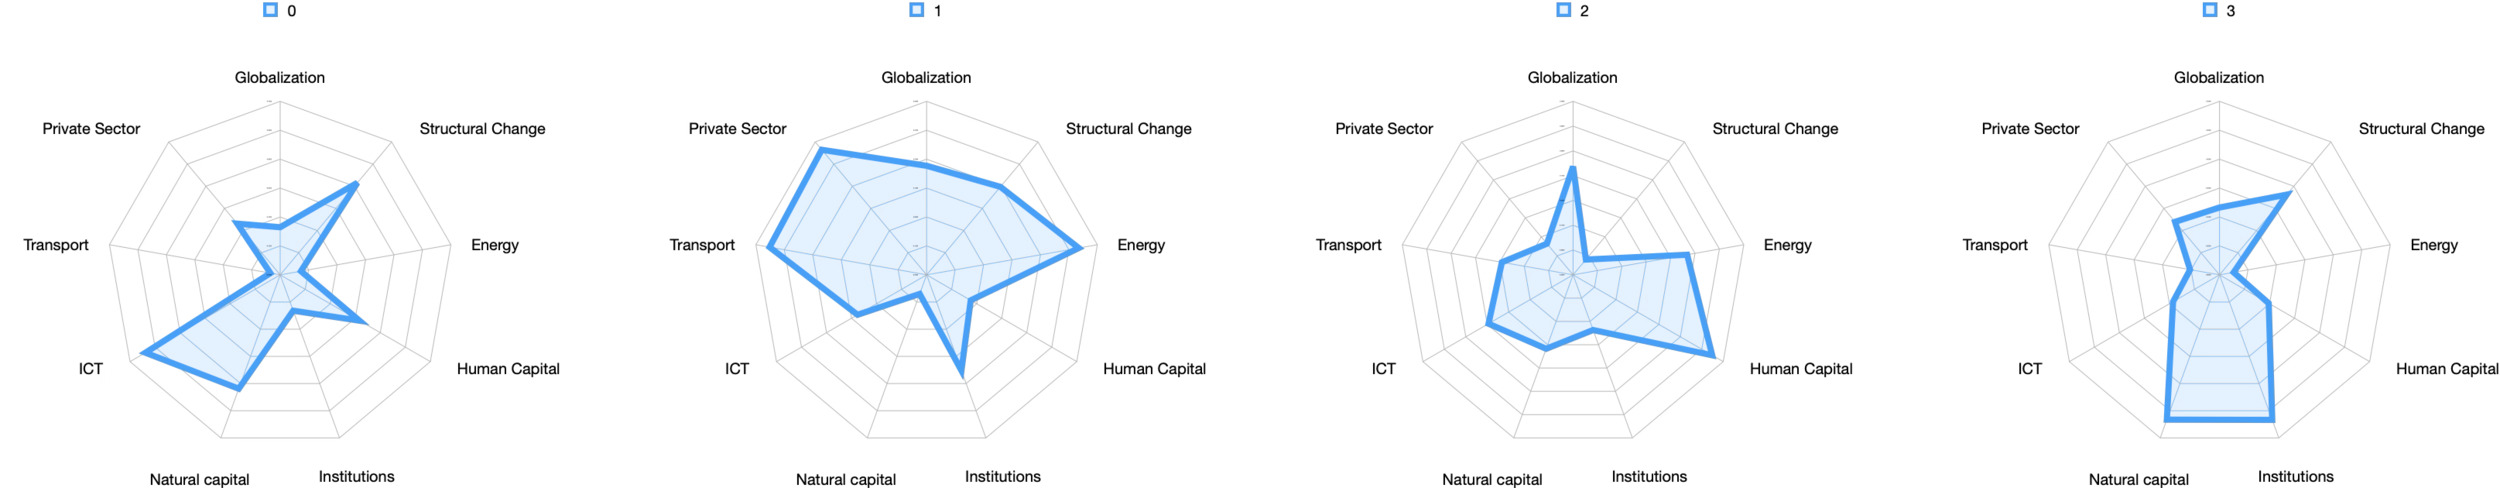
As illustrated in Figure 1, each cluster displays a distinctive pattern across the nine development indicators, highlighting the unique “developmental signature” that characterizes each group of economies.
Introducing the REE Framework: Guidance for Stakeholders
The diversity revealed by this analysis highlights the limitations of traditional models. Based on these findings, I propose the REE Framework—Redefine, Embed, Elevate—as a strategic guide for engaging with emerging economies.
Redefine: Multidimensional Assessment
DTW clustering analysis reveals that traditional metrics, such as GDP growth, fail to capture the complex development realities of emerging economies. For example, Talent-Rich Challengers show strong human capital development but a lag in structural change, whereas Resource Rollercoasters demonstrate strong institutional quality despite the volatility in other indicators.
The redefined component emphasizes the need to:
-
Employ composite indices that integrate multiple development dimensions
-
Consider pattern trajectories over time rather than static snapshots
-
Recognize trade-offs between different development priorities
-
Acknowledge that countries at similar income levels may face vastly different development challenges
For stakeholders, this means moving beyond simple rankings to understand the specific developmental signature of each economy.
Embed: Context-Sensitive Approach
Cluster analysis demonstrates that seemingly similar markets may have vastly different development trajectories.
The embedding component focuses on:
-
Tailoring strategies to the specific development signature of each cluster
-
Recognizing that solutions effective in one cluster may fail in another
-
Designing interventions sensitive to local institutional environments
-
Considering the interaction between globalization and internal capacities
For businesses and policymakers, this means developing refined, cluster-appropriate approaches, rather than applying one-size-fits-all strategies across emerging markets.
Elevate: Leveraging Indigenous Strengths
Each cluster identified in our analysis has unique strengths: Robust Accelerators demonstrate private sector vitality, Talent-Rich Challengers show human capital excellence, Resource Rollercoasters possess institutional resilience, and Steady Risers exhibit a balanced growth potential.
The elevated component encourages:
-
Identifying and building upon the distinct strengths of each cluster
-
Fostering development that amplifies these indigenous advantages
-
Promoting knowledge sharing between countries with similar development signatures
-
Crafting policies and strategies that harness cluster-specific assets
For stakeholders, this means focusing on interventions to reinforce and expand existing strengths, while strategically addressing weaknesses. For instance, in Talent-Rich Challenger economies, strategies might emphasize knowledge-intensive sectors that leverage their human capital advantages, while addressing infrastructure gaps.
Practical Applications of the REE Framework
Business Practitioners
The REE Framework helps business leaders tackle market cluster challenges and opportunities. It suggests looking beyond traditional metrics to understand the potential based on development paths for market assessment. Steady Riser markets, such as China, India, and Vietnam, evaluate gradual improvements across indicators for sustainable growth. Robust Accelerators such as Chile, Malaysia, and Thailand, have developed strategies that leverage strengths in private sector dynamism, energy, and transportation. Talent-Rich challengers, such as Argentina, Egypt, and Greece, focus on human capital advantages for knowledge-intensive businesses. Resource Rollercoaster economies, such as Brazil, South Africa, and Zambia, create volatility-resistant strategies that utilize institutional strength and natural resources.
When embedding strategies, tailored offerings, pricing, and distribution fit the development patterns of the target market clusters. Design market entry approaches considering cluster-specific institutional environments and infrastructure. Develop risk-mitigation strategies for each cluster’s volatility profile.
To enhance local capabilities and partnerships, identify opportunities using strengths of each market cluster, like technology talent in Talent-Rich Challengers or resource management in Resource Rollercoasters. Form strategic partnerships with local entities that complement their capabilities. Invest in capacity-building initiatives addressing development gaps, creating mutual value for business and local economy.
Policymakers
The REE Framework provides policymakers with a new method for crafting effective development strategies by moving beyond traditional geographic or income-based peer groups. To redefine development benchmarks and learning networks, policymakers should form “development affinity groups” based on cluster membership for knowledge sharing among countries with similar challenges. They should design performance metrics reflecting a country’s cluster-specific development trajectory and identify successful policies from economies in the same cluster, even if geographically different.
Embedding policies in cluster-appropriate contexts requires different approaches for each group. Steady Risers should maintain a balanced development while strengthening institutional foundations. Robust Accelerators require policies to sustain sectoral momentum and address imbalances. Talent-Rich Challengers should leverage human capital while tackling infrastructure and structural challenges. Resource Rollercoasters need mechanisms to manage volatility and diversify beyond natural resource dependence.
To enhance indigenous advantages, policymakers should create initiatives that build on a country’s cluster strengths, while addressing gaps. They should encourage cross-border collaboration within the cluster to share best practices and coordinate efforts. Additionally, they should develop regulatory frameworks and incentives to enhance the economy’s comparative advantages within its cluster, fostering an environment in which indigenous strengths drive sustainable development.
How the REE Framework Refines Market Entry and Expansion Strategies by MNEs
The REE Framework equips multinational enterprises (MNEs) with tools to refine market entry and expansion strategies in emerging economies. Unlike methods based on GDP growth or broad regional categories, the framework helps MNEs detect the development patterns of target markets to adjust their strategy. In Talent-Rich Challenger economies (e.g., Argentina, Egypt), MNEs can leverage human capital by developing knowledge-intensive operations or educational services while considering institutional challenges. In Resource Rollercoaster economies (e.g., Brazil, South Africa), the framework aids MNEs in creating countercyclical strategies to handle resource-driven volatility, capitalizing on strong institutions and natural resources. It guides decisions from product localization and pricing to supply chains and partnerships, clarifying which business model aspects need adaptation to a cluster’s development signature versus which can remain standardized.
Conclusions
This analysis reveals that emerging and frontier economies follow distinct development trajectories, beyond traditional geographic or income-based classifications. The REE Framework offers a structured approach to engaging with the complex realities of emerging economies.
For business practitioners, the framework provides a template for developing market strategies that recognize the specific developmental dynamics of each economy. Policymakers gain a new lens for identifying relevant peer countries and designing tailored interventions.
While traditional classifications based on geography or income levels continue to serve essential purposes, this multidimensional pattern-based approach offers complementary insights that capture the dynamic nature of economic development in emerging and frontier economies.
Limitations
Although the clustering approach provides valuable insights, several limitations should be acknowledged. First, the PCI and KOF indices may not fully capture inequality dynamics within countries. Second, the framework provides limited insights into innovation ecosystems and entrepreneurial activities. Finally, while broadly capturing institutional quality, the framework may not fully reflect the specific political risks crucial to multinational enterprises. Despite these limitations, the REE Framework substantially advances our understanding of diversity in emerging markets.
Acknowledgments
Special gratitude goes to the editors and anonymous reviewers for their constructive comments, which significantly improved this manuscript.
About the Author
Ricardo E. Buitrago R. is an Associate Research Professor in Strategy and International Management at EGADE Business School, Tecnologico de Monterrey. Previously, he served as program head and dean at Colombian universities and as a visiting professor across Latin America. His research focuses on international political economy, institutions, strategy, and international business, with publications and editorial contributions in journals such as the Journal of Business Research, Thunderbird International Business Review, and European Management Journal, among others.