
Introduction
“Tariff is the most beautiful word in the dictionary,” claimed candidate Trump when he appeared before the Economic Club of Chicago in October 2024. Although the Supreme Court of the US overturned the ability of the White House to impose reciprocal tariffs under the International Emergency Economic Powers Act (IEEPA) on the 20th February, 2026, Trump turned to a more powerful tool to continue his trade policies: Section 301. This section of the Trade Act of 1974 allows tariffs to be imposed if trading partners are proven to act in a discriminating way or have policies and practices that are unreasonable (Elms, 2026). Immediately after the Supreme Court decision, the US opened a new investigation against 60 major trading partners, including the EU and China. Tariffs may continue to play an important role in the US trade agenda for several years to come. But the fundamental question a manager would want to know is: Who ultimately pays for these tariffs? To what extent can the importer pass on part or all of the tariff to the consumer?
The claim that foreign partners will always bear the full cost of tariffs is a misconception (Steil, 2025). The burden of a tariff is ultimately distributed among the foreign exporter, the US importer, and the end consumer through a complex negotiation process (Amiti, Redding, & Weinstein, 2019; Cavallo, Gopinath, Neiman, & Tang, 2021). When Donald Trump imposed a 25 percent tariff on foreign-made vehicles, German carmakers responded by passing on about 80 percent of the tariff to the customer in various discreet ways (Inagaki, 2025). US importers of Christmas decorations had to pay tariffs ranging from 10 to 145 percent. However, during the festive season, 83 percent of American households would still opt for the artificial ones (Rogers & Savage, 2025).
While many companies still rely on reactive, ad hoc responses to geopolitical events (Habegger, 2024), managers need structured, systematic tools to proactively manage these exposures and preserve strategic flexibility under volatile trade conditions (Ma, 2025). To help managers assess which side has more leverage, we utilize a 2x2 matrix framework. This framework positions products based on two key metrics:
-
First is price competitiveness, which looks at whether an exporter’s price is above or below the global market average.
-
Second, the rearrangement ratio (a metric that measures the extent to which imports from one source can be replaced with another). It quantifies the ability of an importing country to shift its purchases from one trading partner to others.
To do so, managers must assess their position within the bargaining framework presented in Table 1.
-
Exporters in the vulnerable top-left quadrant must prepare for pressure to absorb tariff costs or risk losing market access.
-
US importers who rely heavily on suppliers with high rearrangement ratios face significant price risk. Proactively diversifying supply chains, even at a higher day-to-day operating cost, is a critical strategy to mitigate the impact of future trade disputes (see also Ahn & Tan, 2025).
-
For products with high rearrangement ratios (like certain Chinese consumer goods and smartphones), the structural inability of US firms to substitute suppliers means a significant portion of the tariff burden will be transferred to the American consumer.
-
While some operations may inevitably need to move back to the US, before rushing into costly relocation decisions (Adarkwah, Dorobantu, Sabel, & Zilja, 2024; Dachs, Kinkel, & Jäger, 2019), firms should deploy aggressive non-market strategies to mitigate policy risks. This involves engaging in corporate political activity – either individually or through industry coalitions – to influence trade policy and secure exemptions (Doh, McGuire, & Ozaki, 2015).
Framework for Analysis: Price Competitiveness and the Rearrangement Ratio
To systematically evaluate the bargaining power of trading partners, we utilize a 2x2 matrix framework. This framework positions products based on two key metrics. First is the level of price competitiveness among exporting countries, measured by the deviation of an exporter’s price from the average market price. We calculated these unit prices based on global trade data (United Nations Statistics Division, 2025). A lower relative price gives the exporter a competitive advantage.
Second, the rearrangement ratio, adapted from a concept developed by McKinsey & Co. (White et al., 2025), which simply quantifies how hard it is to replace a supplier quickly – the ability of an importing country to shift its purchases from one trading partner to others. A higher ratio indicates greater difficulty for US importers in finding alternative suppliers, giving the existing foreign exporter greater leverage.
Bhaumik et al. (2023) emphasize that bargaining power is shaped by the outside options of negotiating partners. This is clearly seen in US–China Christmas decorations trade, where a high rearrangement ratio for such goods indicates a critical lack of alternative suppliers for US importers. For example, the US imports over $3 billion in Christmas decorations from China, while the entire global export market, excluding China’s exports to the US, is only $600 million. In some cases, such as for certain clocks and electric blankets, China is the sole source for US imports.
The analytical matrix illustrated in Table 1 below shows how the two factors determine the likely distribution of the tariff burden, and dictates the appropriate managerial response for each scenario.
Putting the Framework to Work: Case Studies in High-Stakes Sectors
Our analysis focuses on the 30 most significant trading partners of the US, using tariff data from the Financial Times’s Trump tracker as of August 7, 2025 (FT reporters, 2025). We examine two distinct product categories to illustrate how the framework helps managers anticipate tariff burdens and formulate strategic responses.
Smartphones: The Bottom-Right Quadrant (Burden on the Consumer)
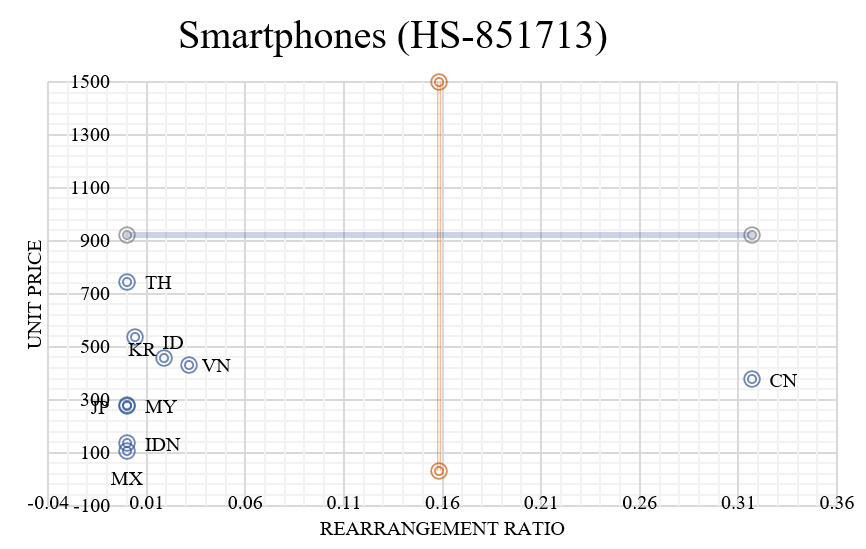
China dominates the US smartphone import market in 2024 with an 81% share, followed by India and Vietnam. The prices from these three leading exporters are comparable. China’s position in the bottom-right quadrant of our framework – highly price-competitive with a very high rearrangement ratio – means replacing it as a supplier would be difficult in the short term.
Figure 1 plots the major smartphone exporters to the US on two dimensions: the vertical axis measures relative price competitiveness, with lower positions indicating more competitive prices, while the horizontal axis measures the rearrangement ratio, with points farther to the right indicating suppliers that are harder to replace. Each labeled point represents an exporting country. China’s position in the bottom-right quadrant of the framework shows why smartphone tariffs are likely to be passed through to US consumers: it combines price competitiveness with limited short-run substitutability, making replacement difficult in the short term.
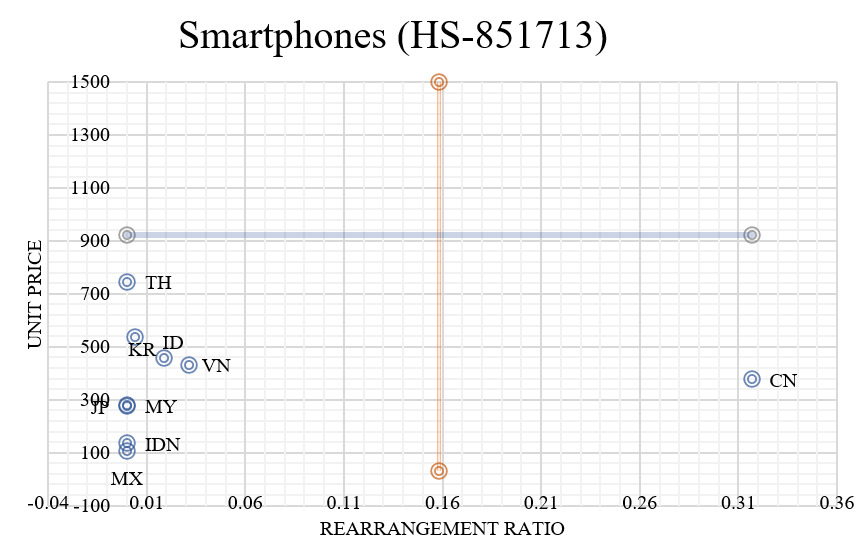
Consequently, any tariffs imposed on smartphones would likely be borne by US consumers, which explains why such products were very quickly exempted from tariffs (Doherty, Kim, & An, 2025). As recommended by the framework, the appropriate managerial response here is to prioritize non-market strategies to secure these exemptions. Quick action to highlight the burden on consumers to policymakers through lobbying can avoid losing market share. Nevertheless, the significant gap between the average import price (USD358) and US export price (USD259) suggests potential for expanding domestic production in the future.
Electric Vehicles (EVs): The Push for Strategic Localization
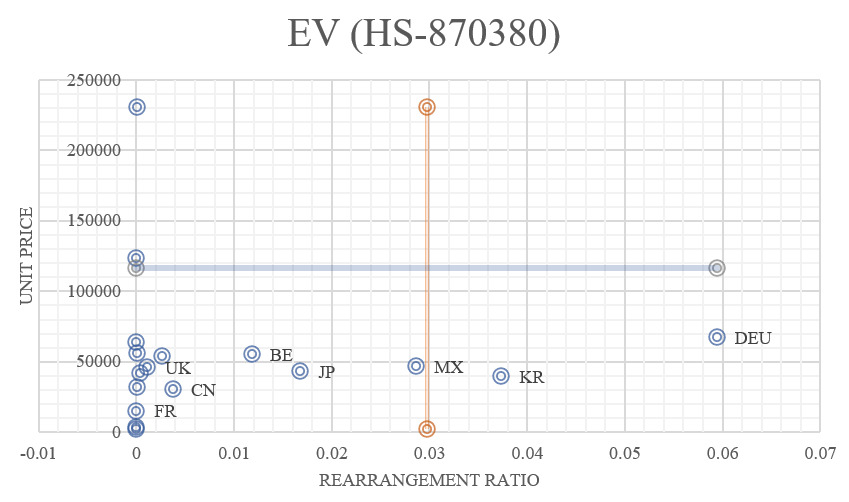
The US imported 470,000 EVs (valued at USD23 billion) in 2024, with Mexico, Germany, South Korea, and Japan supplying over 90% of the total quantity and value. These major exporters offer vehicles at a similar average price point of about $50,000.
Figure 2 maps the main EV exporters using the same two axes: the vertical axis captures relative price competitiveness, and the horizontal axis captures the rearrangement ratio, or how difficult it is for US buyers to replace a supplier. Each country label marks an exporting country’s position in the tariff-bargaining framework. Countries located in the right-hand quadrants are harder to substitute, while those in the left-hand quadrants face stronger competitive pressure from alternatives; this is why some exporters can sustain partial pass-through, whereas others face a greater risk of absorbing part of the tariff burden themselves.

Given the competitive pricing and moderate rearrangement ratios, tariffs imposed on these imports are initially passed on to consumers. Real-time market data supports this: German automakers reportedly passed on approximately 80% of the tariff burden to US customers (Inagaki, 2025). Volkswagen introduced a separate “import surcharge” on official price labels to transfer the full cost to consumers, while BMW raised retail prices by 4% on specific models to partially offset the duty (Boeriu, 2025; Reuters, 2025). Japanese automakers, on the other hand, sit in bottom-left quadrant, implying a high threat from substitutes. Negotiating a shared burden of the tariff will be difficult for them unless there is a clear price advantage.
However, as the US also has a robust and growing domestic EV industry (Taylor et al., 2025), localization of production is a highly probable medium-term outcome. This dynamic is increasingly visible as US policies actively penalize reliance on Chinese supply chains, forcing multinational enterprises to urgently seek alternative inputs from allied nations (Li, Shapiro, & Vecino, 2025).
The Economy-Wide Reality: Why Substitution Is So Difficult
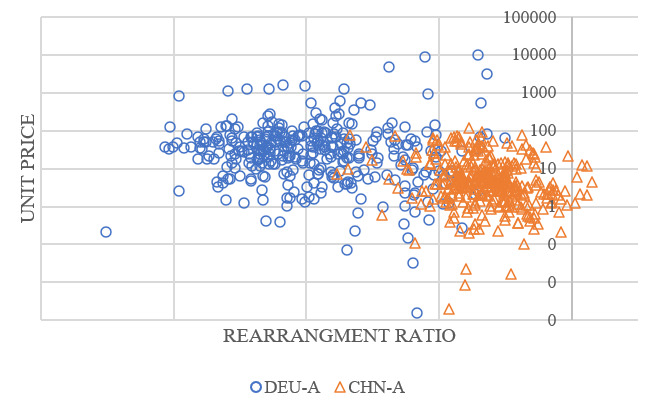
An economy-wide view of export items from Germany and China to the US reveals a significant difference in the negotiating power of the two exporters. We grouped these exports according to resource, labor, and technology intensities to understand where US importers face the greatest substitution challenges.
For less-complex manufactured goods, the difference in product positions indicates China has substantial market leverage compared to Germany.
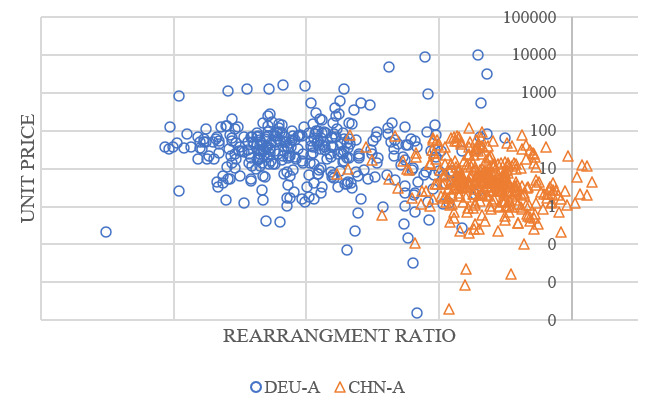
Figure 3 shows the relationship between relative price competitiveness and the rearrangement ratio for each product category (at the 6-digit HS level) exported from China or Germany to the US. The difference between Chinese and German products suggests that China holds stronger bargaining power in labor-intensive and resource-intensive segments, making supplier substitution more difficult and costly for managers. Figure 3 also shows that China has successfully established itself as a difficult-to-replace supplier for US importers in these segments, whereas Germany’s exports are relatively more expensive and easier to substitute. This pattern suggests that tariffs on lower-end manufactured goods are more likely to create substitution difficulties and consumer pass-through when Chinese suppliers dominate.
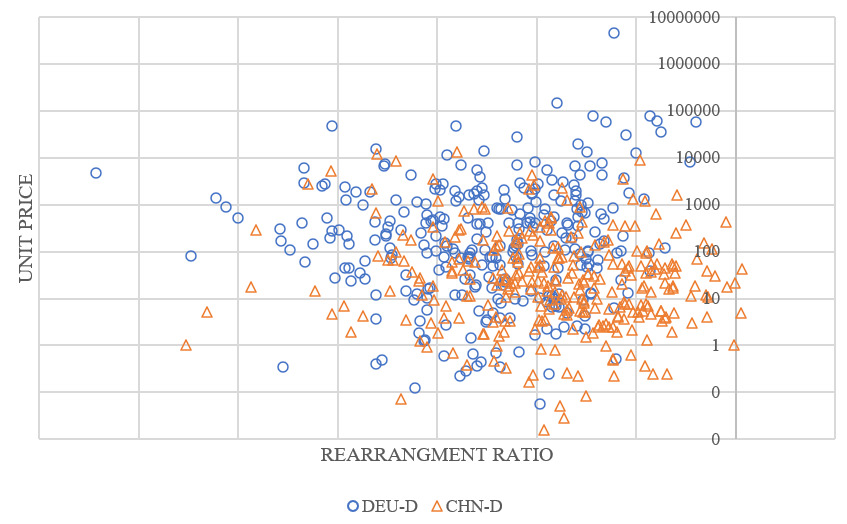
However, the critical takeaway for managers lies in the technology-intensive sectors. For more technology-intensive goods, while China’s leverage is not as high, it is becoming a direct competitor to Germany. As we move up the value chain into high-skill and technology-intensive manufactures, the separations previously seen disappear, indicating a convergence of German and Chinese trade profiles. Figure 4 shows the relationship between relative price competitiveness and the rearrangement ratio for each product category (at the 6-digit HS level) exported from China or Germany to the US. The overlap between Chinese and German products suggests that China competes directly with Germany in technology-intensive segments, making supplier substitution more difficult and costly for managers.
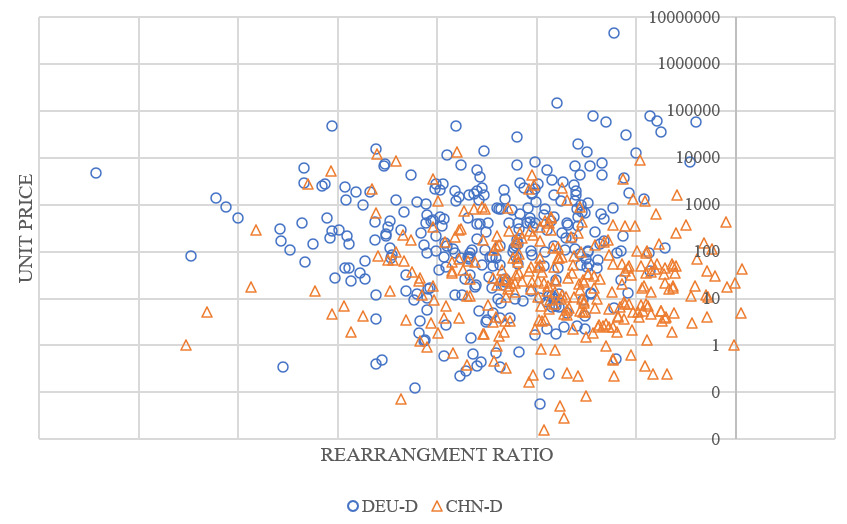
This evidence demonstrates that viewing Chinese goods as merely cheap, labor-intensive, and low quality is no longer accurate (UNIDO, 2024; World Bank, 2025). China is clearly a dominant player for labor and resource-intensive segments, but more importantly, it is a direct competitor to Germany in the technology-intensive segments, offering a full range of goods that traverse the spectrum of quality, price, and market power.
For international firms, this convergence means that shifting high-tech supply chains away from China in response to tariffs is not simply a matter of finding a cheaper labor market; it requires replacing a highly integrated, technologically advanced supplier base—a reality that makes sudden localization or supply chain relocation exceptionally costly.
Conclusion: A Strategic Playbook for International Business
The claim that foreign partners will always bear the full cost of tariffs is a misconception (Steil, 2025). As our analysis demonstrates, costs of production are embedded in the complex value chains of international business and are frequently transferred to the domestic economy.
For international firms, the implications are clear: managers must move beyond reactive, ad hoc responses to geopolitical events (Habegger, 2024) and actively build resilience against an increasingly uncertain global environment (Dau, Moore, & Newburry, 2023; Habegger, 2024). By utilizing the framework presented in Table 1 to identify their specific tariff exposures, firms can proactively deploy the following strategies to mitigate risk and stabilize costs:
-
Deploy Aggressive Non-Market Strategies: Before committing to capital-intensive localization (Adarkwah et al., 2024; Dachs et al., 2019), firms should engage in corporate political activity—either individually or through industry coalitions—to secure tariff exemptions (Doh et al., 2015). A prime illustration is Apple’s success in negotiating an iPhone exemption despite the 50 percent tariffs in place at the time. Apple paired this lobbying with a gradual shift of US-bound assembly operations to India, allowing the firm to navigate policy risks while reconfiguring its supply chain.
-
Leverage the “Regressive Tax” Narrative: Successfully executing non-market strategies often requires sophisticated media campaigns to shape public perception (Zhang, 2025). Tariffs frequently function as a regressive tax (Amiti et al., 2019; The Budget Lab at Yale, 2025), disproportionately affecting lower-income households who spend a larger share of their income on consumer goods. By explicitly highlighting this unintended domestic burden to regulators, firms can effectively lobby to delay or reduce tariff implementations.
-
Execute Phased Reconfigurations, Not Sudden Localizations: For industries like EVs and smartphones, tariffs may accelerate a strategic shift toward “in-America-for-America” production models. However, bringing manufacturing back to the US cannot realistically encompass the entire supply chain, as production processes today are too fragmented and costly to replicate entirely. Managers must use short-term tariff exemptions as a strategic pause, buying time to stabilize costs and secure alternative inputs from allied nations (Li et al., 2025), while preserving the strategic flexibility needed for phased reconfiguration rather than abrupt relocation (Ma, 2025).
Ultimately, the US government must recognize that revenue from tariffs does not come solely from foreign entities (Hufbauer & Zhang, 2026). In the meantime, business leaders who understand the bargaining power dynamics of their supply chains will be best positioned to avoid unnecessary disruption and protect their corporate competitiveness.
About the Authors
Bala Ramasamy is Professor of Economics, and Director of the GEMBA Program at CEIBS, having joined in 2006. He previously held faculty positions at the University of Nottingham and the University of Macau. He received his Ph.D. from the University of Leicester. His research focuses on Asian economies, FDI, Corporate Social Responsibility, and International Business Strategy, with publications in Journal of Business Ethics and Journal of World Business. He is a frequently cited expert in global media.
Matthew Yeung is the Dean of School of Open Learning at Hong Kong Metropolitan University. He holds a Ph.D. from the University of Nottingham. His research focuses on International Trade, Foreign Direct Investment, consumer sentiment, and Big Data Analysis. His work, which also covers Business Ethics and Sustainable Development, has been published in the Journal of Business Ethics, The World Economy, Journal of World Business, and Journal of Business Research.